## Drawing a graph
Visualising neural networks gives insight on which node have a larger effect on the output. And especially in evolving neural networks, it shows the characteristics of an ideal network. Setting up a graph is fairly easy:
#### Index.html
The html file should include [d3v3](http://d3js.org/d3.v3.min.js) and [webcola](http://marvl.infotech.monash.edu/webcola/cola.v3.min.js). Ofcourse you should also provide the neataptic.js file and the graph.js file from above. This is an example of the html file:
```html
```
#### Script.js
If you want to work from a script, make sure to use the jquery `$( document ).ready()` function. Drawing the graph looks something like this then:
```javascript
// Global var
var network;
$( document ).ready(function() {
network = new neataptic.Architect.Perceptron(2, 10, 6, 5, 35, 1);
drawGraph(network.graph(1000, 1000), '.draw');
});
```
You can draw a graph using:
```javascript
drawGraph(data, dom_element);
```
Retrieve your networks graph:
```javascript
var data = myNetwork.graph(width, height);
```
#### Graph.js
In the graph.js file, make sure to set the `WIDTH` and `HEIGHT` to the desired amount.
```javascript
[...]
var NODE_RADIUS = 7; // radius of circles on graph
var REPEL_FORCE = 10; // force power between circles
var LINK_DISTANCE = 100; // length of a connection
var WIDTH = 1000; // width of your graph
var HEIGHT = 500; // height of your graph
[...]
```
#### Graph.css
Make sure to include graph.css in your html file. This makes sure your connections are visible and makes the nodes more eye-appealing.
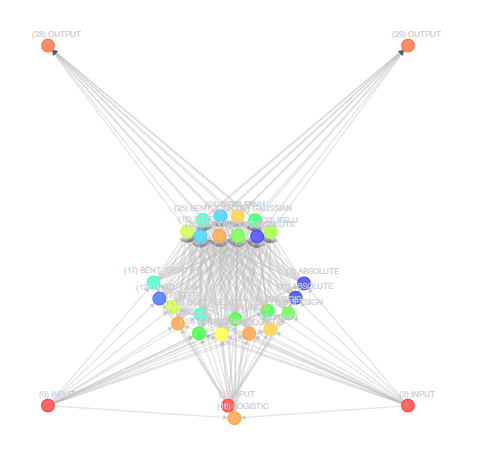
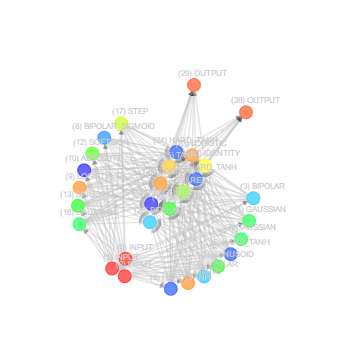
## Disable constraints
Normally graphs look like the network on the left. If you want a more fluid design, disable constraints, and you'll get a graph like on the right:
In `graph.js`, remove line 60:
```js
.constraints(graph.constraints) // remove this line
```
This basically makes the input and output nodes less distinguishable.
 In `graph.js`, remove line 60:
```js
.constraints(graph.constraints) // remove this line
```
This basically makes the input and output nodes less distinguishable.
In `graph.js`, remove line 60:
```js
.constraints(graph.constraints) // remove this line
```
This basically makes the input and output nodes less distinguishable.